Overview
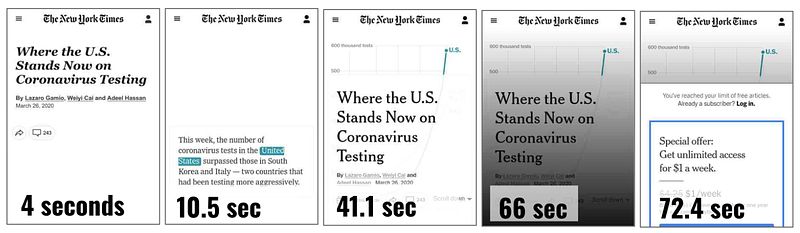
We introduce "visualization islands," a term describing how technical barriers — slow-loading webpages and accessibility errors — can isolate data visualizations from their audiences. Even a carefully designed chart can fail to reach people if the page hosting it is slow, paywalled, or inaccessible to screen readers. We analyzed more than 3,000 webpages hosting COVID-19 visualizations to map where these barriers show up most, and who they leave out.
Approach
We based our analysis on the COVIC (COVID-19 Online Visualization Collection) archive, drawing on over 3,000 visualizations published during the pandemic. For each webpage, we measured:
-
Accessibility, using WebAIM's WAVE tool to check for WCAG violations like missing alt text, low contrast, and improper ARIA attributes
-
Performance, using WebPageTest to simulate load times under three connectivity conditions — 3G, DSL, and fiber
This let us look at reachability holistically, rather than evaluating a visualization's design in isolation from the environment hosting it.